Database of the Month: Mediamark Reporter - Consumer Survey Data

Mediamark University Internet Reporter (“Mediamark Reporter”) presents demographic, lifestyle, product, brand, and media data from GfK MRI’s Survey of the American Consumer, a national survey of over 25,000 consumers. Through personal in-home interviews, the Survey collects demographic data (age, income, educational level, etc.), media usage information (including print, television, online and social media), and details about the products and services that they buy and use.

Why use Mediamark Reporter?

Use Mediamark Reporter to identify a target market and profile consumers. Data is reported for more than 6,500 products and services in 600 categories, making this database an important resource for students working on GB214, GB320, marketing, and corporate immersion projects.

For example, you can use Mediamark Reporter to find the demographic characteristics of people who:

  • drink bottled water more than 8 times a week
  • subscribe to Netflix
  • spent more than $250 on sports equipment in the past year
  • pay bills using their mobile device
  • watch NBA games on TV on a regular basis
  • have used a dating app in the last 30 days
  • have purchased Converse sneakers in the past year
  • “always” vote in national, state and local elections

Beyond basics: Report types and custom targets

Utilize Mediamark Reporter’s options to create custom reports:

  • The default report is “standard” report, which shows data from one survey period. Select “trend” report to view three years of data side-by-side.
  • Combine targets to customize brand or usage data.
    • For example, when viewing the Bottled Water reports you may decide you’d like to combine data for multiple brands. Select the brands you are interested in (e.g. Smartwater and Fiji), then choose either Any of These Items (to OR your selections) or All of These Items (to AND your selections) to create a custom target.
  • Create custom demographic targets under the “Reporter Options” settings.
    • For example, you can create a custom Household Income (HHI) category by combining the HHI $50,000-59,000 category with the HHI $60,000-74,999 category to create a new user-defined category of HHI $50,000-74,999.

You can find more information about these customization options in the help documentation listed below.

Register for a Mediamark account

To use Mediamark Reporter you must create an account using your Bentley email address. Mediamark accounts automatically expire two times per calendar year — on June 30 and December 31. Users will need to re-register after January 1 and July 1 each year for access to the Mediamark database.

Account registration instructions are available at libguides.bentley.edu/consumers/mediamark.

Help guides, search tips, and more

Mediamark’s interface and navigation are unlike other databases, and the reports are a bit tricky to read without help. The most important thing to have in front of you while using Mediamark is the the 1-page How to Read a Mediamark Report, which describes how to interpret Mediamark data. The 15-page Mediamark Tutorial explains how to customize your reports.

You can find additional Mediamark Reporter search tips, help guides and tutorials on the Consumer and Market Research Guide. Visit or contact the Reference Desk for personal assistance using Mediamark Reporter.


Database of the Month provides a very brief introduction to a useful website or Library database, highlighting key features you should know about. If you would like more information about this resource (or any of the library’s databases), please contact us for research assistance. If you would like a demonstration of this resource for a class, please schedule a research instruction class using the instruction request form.

Database of the Month: Nexis Uni

Aggregating a wide range of content, all from credible sources in news, law, and industry, Nexis Uni is essential when researching global and regional newsworthy events, U.S. State and Federal law, and U.S. and foreign business.  Formerly Lexis Nexis Academic, Nexis Uni features a new interface and enhanced functionality designed with input from students and researchers enabling you to quickly and effectively discover, collect, and organize information.   

A good example is the highlighted text search, which makes the text of any document you find within Nexis Uni an entry point to related documents.  With your mouse, highlight text, then copy or add the text to take your search in another direction:

The option to save items to a personal Nexis Uni account, Drop Box, or Google Drive, allows you to gather and organize documents first so that you can easily find and read them later.

You may also register for a personal account which lets you customize your search experience and which lets you create alerts notifying you of content added to Nexis Uni which include search terms you specify:

For legal research, use “Get a Doc Assistance” located on the main search page.  This feature enables you to obtain documents by creating the appropriate legal citation according to content type and jurisdiction and to find cases by party names or by docket number. 

Go to Nexis Uni from the link provided for Lexis Nexis Academic on the libraries Databases A-Z page to take advantage of this valuable resource for your assignment, research, or curiosity. 


Database of the Month provides a very brief introduction to a useful website or Library database, highlighting key features you should know about. If you would like more information about this resource (or any of the library’s databases), please contact us for research assistance. If you would like a demonstration of this resource for a class, please schedule a research instruction class using the instruction request form.

Database of the Month: CQ Researcher

Getting started with CQ Researcher

CQ Researcher shines a bright light on the significance and legacy of the events and issues of the day. Use CQ Researcher for assignments in global studies, comparative government, and expository writing classes. Its strengths are international affairs, health, social trends, criminal justice, education, the environment, technology and the economy.  

Here is a small sample of the questions that CQ Researcher has answered for users recently: 

Q: I need sources on affirmative action and need more of the “Con” argument.

Q: Should college athletes be paid?

Q: I have a paper for expository writing on Texas Campus Carry Law and gun control, can you help me?

Q: Where can I find federal and local policies regarding legalization of marijuana?

Q: Can you help me find information on prison reform; I am trying to find two sides to the issue.

Q: I am having trouble choosing a topic for an upcoming research paper!

CQ Researcher offers short reports, long reports of 12,000 words, and “hot topics” which are constellations of all reports CQ Researcher has published on that particular topic, historic or current. Each report has one theme. Entering a search term such as “Brexit” fetches 50+ pieces, including a detailed and current account of the issue containing photographs, charts, and references.

Reports take care to balance the discussion. CQ Researcher is not peer-reviewed, but it is powerful because of its depth of discussion and thorough fact-checking. Embedded in each report are links to the bibliography and several additional readings, making the discovery process efficient and highly relevant.

Hot Topics section
“Hot Topics” are CQ’s most popular research topics

Select and pursue a subject

CQ Researcher displays a list of 30+ topics in the pull down menu under “Browse Topics”. We recommend this section to someone seeking a topic to study. 

Browse topics menu
Rich “browse topics” menu

For topics not immediately displayed under the broad categories, there is a search box at the top of the page and a link to an Advanced Search form.

To search for cybersecurity, your options include:

  • Browse Topics for Science & Technology > Computers > Cybersecurity
  • Enter cybersecurity in the search box
  • Use the Advanced Search form to apply additional search filters and limiters

CQ Researcher is not focused on consumer goods nor industry profiles, but will provide demographic information in the context of a larger report, for example, the number of Europeans who see value in EU leadership in the years 2007- 2018.  

EU Membership chart
Charts and graphs used in CQ Researcher always advance the discussion

Structured arguments

Users can expect to hear the voices of seasoned journalists presenting well-developed arguments in each entry. Debaters will love the valuable talking points in the Pro/Con section, and for users who want to form research questions, the forward- looking statements in each long report’s “outlook” section are especially helpful.  

pro/con essays
Figure showing pro-con section

Their backstory

CQ Researcher has a strong visual aesthetic, reflecting its origins as Editorial Research Reports, a print publication begun in 1923. Co-founded by Richard M. Boeckel and Bertram Benedict, their publication was primarily for the benefit of editorial writers. As a young Capitol Hill correspondent for the New York Tribune covering the League of Nations debate after World War I, Boeckel realized how little he and his fellow reporters knew about the background of the issues they were following, so they formed a publication. It has evolved and changed names twice: first in 1956 to Congressional Quarterly and again in 1991 to CQ Researcher, its current name. Sage Publishing owns CQ Researcher today.

Awards

CQ Researcher has been recognized for excellence by the Society Of Professional Journalists and by the American Bar Association (Silver Gavel, 2002) for a nine-part series on liberty and justice issues.  

Connect to the Database

Visit the library’s Databases A-Z page and select CQ Researcher. This database is also displayed in the subject lists for General Topics, Education, History, News, and Politics and Government.


Database of the Month provides a very brief introduction to a useful website or Library database, highlighting key features you should know about. If you would like more information about this resource (or any of the library’s databases), please contact us for research assistance. If you would like a demonstration of this resource for a class, please schedule a research instruction class using the instruction request form.

Database of the Month: Statista

Need statistics for a research assignment? This month’s database of the month, Statista, is a great place to look!

Statista Logo

Statista is a portal for quantitative data and statistics. This database provides statistics related to industries, markets, consumer behavior, media, and more both in the United States and worldwide.

Screenshot of Statista homepage. Displays navigation menus and main search box.
Statista Homepage as of April 2019.

Use the search box to find information on your topic of interest or browse via the drop-down menus which provide access to different types of information available in Statista.  Statistics can be downloaded in Excel, PNG, PowerPoint and PDF formats.

Result page in Statista for "Number of recreational visitors to Boston National Historical Park in the United States from 2008 to 2018 (in millions)". Displays chart, download options, description of chart, and citation tool.
Example result in Statista. Visit this page on Statista’s website.

Each result page offers an exportable chart or graph, a brief description of the data, and points to the source of the data should you want to track down more information from that source. A citation tool is provided to make it easier to cite the material if you are using it in a paper or project. Suggested citations are available for APA, MLA, Chicago, Harvard, and Bluebook citation styles. Other options provided by Statista include adjusting the chart type under “Settings” and you can also share this information on social media.  Some charts and graphs can even be embedded with HTML code into websites!

In addition to the individual charts and graphs, Statista offers a variety of reports that compile statistics that can help with your research. Statista Dossiers organize top sets of quantitative charts and graphs on a topic onto one browseable page. These collections can be exported as a PowerPoint or PDF file. Take a look at this Statista Dossier on Netflix as an example. 

If you have any questions about using Statista, please reach out to a Bentley Reference Librarian. You can also check out Statista’s Help & FAQ page.

———————————————

Database of the Month provides a very brief introduction to a useful website or Library database, highlighting key features you should know about. If you would like more information about this resource (or any of the library’s databases), please contact us for research assistance. If you would like a demonstration of this resource for a class, please schedule a research instruction class using the instruction request form.

Database of the Month: LinkedIn Learning

logo for linkedin learning

Whether you want to enhance your work performance with a new skill, round out your résumé, or learn something new for personal development, LinkedIn Learning can help! Choose from more than 6,000 individual courses and short videos, taught by industry experts, on business, creative/applied arts, and technology topics.

Get Started With LinkedIn Learning

Use the search box to enter keywords for skills, subjects or software. Alternatively, use the Library dropdown menu to browse course offerings.

Browse menu for LinkedIn Learning courses in English

LinkedIn also offers written and visual content in Chinese, French, German, Japanese, Portuguese, and Spanish. (Some audio tracks are by native speakers and some are dubbed.) Scroll to the bottom of the page and select the desired language to see what’s available.

Learning Paths

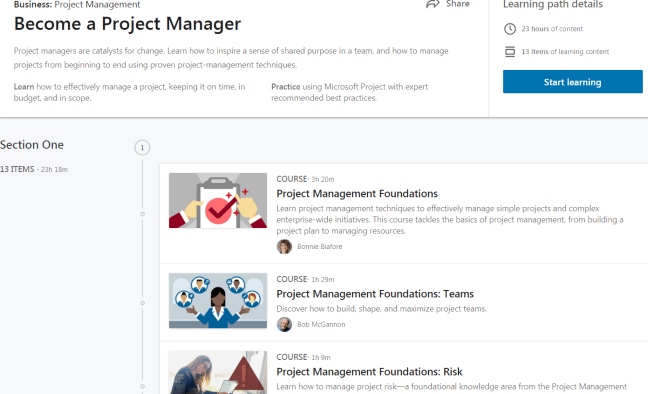
If you’d like to take multiple courses on a single topic, you can make your own lists, or you can let LinkedIn do the work for you with its pre-assembled collections related to specific job types. Choose from the Learning Paths browse list shown in the image above, or enter a keyword or two in the search box. Course lists and links are displayed along with the time needed for completion. Please note that LinkedIn Learning Paths lead to a LinkedIn badge of completion, not an official certification credential.

A pre-assembled course list for Project Management

Mobile Access

Courses may be downloaded to a mobile device. The LinkedIn Learning app is available for iOS and Android phones in the App Store and/or the Google Play Store.

Connect to the Database

Please visit our Databases A-Z page and click LinkedIn Learning to begin your search. This database appears in the Business Topics, Education, IT/CIS, and Marketing subject lists on the A-Z page.


Database of the Month provides a very brief introduction to useful library databases, highlighting key features you should know about. If you would like more information about this resource (or any of the library’s databases), please contact us for research assistance. If you would like a demonstration of these resources for a class, please schedule a research instruction class using the instruction request form.

Database of the Month: Gartner Group Resources

Gartner Group Resources provides expert analysis and opinion on IT-related topics at the intersection of business and technology. Users can search Gartner’s proprietary research by market area, topic, or industry. Gartner also offers blogs and podcasts.

Gartner methodologies consist of research practices and procedures that distill large volumes of data into clear, precise recommendations so their clients can formulate plans or make difficult business decisions.

Gartner provides insights on major function areas including, Finance, Human Resources, Information Technology, Marketing & Communications, and Product R&D, in every market sector. Gartner provides a number of proprietary research products and services including the Gartner Magic Quadrant, Hype Cycles, Peer Insights, and Special Reports. IT related business topics can be found in the Research Library section of the Gartner database.

Gartner Magic Quadrants provide users with a graphical interface that examine four types of technology providers: Leaders, Visionaries, Niche Players and Challengers. Magic Quadrant industry areas include Communications, Manufacturing Technology, Services Technology, and Transportation. Topic areas covered include Business Applications, Software Infrastructure, IT Services, Business Objectives and Application Development.

Gartner Hype Cycles provide a graphic representation of the maturity and adoption of technologies and applications. Hype Cycle methodology provides a view of technology and applications as they evolve over time.   Hype Cycle topic areas include Technology, Society & Public Policy, Business Applications, Software Infrastructure, Business Objectives and IT Management. 

Access to Gartner is via Bentley University username and network password.


Database of the Month provides a brief introduction to useful library databases, highlighting key features you should know about. If you would like more information about this resource (or any of the library’s databases), please contact us for research assistance. If you would like a demonstration of these resources for a class, please schedule a research instruction class using the instruction request form.

Database of the Month: Mergent Intellect

Logo for the Mergent Intellect database

Mergent Intellect offers comprehensive data on companies, industries, demographics, consumer lifestyles, people, and jobs. Among its specialized offerings are:

  • Information on over 245 million domestic and international public and private companies
  • First Research industry profiles
  • United States census data, searchable by geographic area
  • Nielsen PRIZM demographic and consumer reports
  • Residential contact and lifestyle data for U.S. residents
  • Job listings for companies in the U.S. and Canada

Mergent provides both standardized reports and custom reporting tools that are perfect for building lists of competitors, viewing potential customers in a geographic area, and more.

Get Started with Mergent Intellect

Use the basic search box to execute a Company, Industry, Executive or New Business search. Alternatively, click one of the icons located below the search box for other specialized searches.

Other searches available in Mergent: Advanced Search, Residential Search, First Research Industry, Demographics, Consdumer Data, Learning (Help) Center and Key Business Ratios.

Company & Industry Data

Mergent provides information on domestic and international companies. Both public and private companies are included, as are inactive companies. Search by company name, ticker symbol or URL in the single search box to access company profiles, financials, industry profiles, and executive information.

To build custom lists of companies with specific criteria, use the Advanced Search. Both Company and Executive criteria are available. Lists may be exported to CSV or XLSX format.

Company criteria are displayed; click links in the highlighted box to add more fields

Demographics Data

Standardized reports provide an overview of the characteristics of a geographical area using data from the most recent US Census and the proprietary PRIZM segmentation system from Nielsen (Claritas 360). Search by ZIP code, city or county name to access eight different reports, ranging in complexity from quick facts to full overviews. Most are available in both PDF and XLS formats.

Household income for Middlesex county, MA: 2010 actual-2024 projection

Get Database Help

Visit the Help Guides for detailed instructions on searching and building reports. How-to videos help with navigating Advanced Search, Consumer Lifestyle searches, and more.

In-person assistance is available from Bentley librarians; our Bentley Library Research Help page contains contact information and Reference Desk hours.

Connect to the Database

Please visit our Databases A-Z page and click Mergent Intellect to begin your search. This database can also be viewed in the Annual Reports and SEC, Company Profiles, Consumer Demographics, Industries and Markets, and International Business subject lists on the A-Z page.


Database of the Month provides a very brief introduction to useful library databases, highlighting key features you should know about. If you would like more information about this resource (or any of the library’s databases), please contact us for research assistance. If you would like a demonstration of these resources for a class, please schedule a research instruction class using the instruction request form.

Database of the Month: OverDrive

Read for Free from a Phone, Tablet or Laptop through the Bentley Library

December is a great time to highlight the Library’s OverDrive Collection. As you pack up to go home for the holidays, remember the OverDrive downloadable collection is available for you to enjoy on break, anywhere, 24×7 on any device.

This collection includes thousands of fiction and nonfiction titles including many bestsellers and award winners.

Simply click into OverDrive to view our newest additions or to browse the ebook and audiobook collections by subject, format or genre.  You may browse the available titles without logging in. You only need to log in when you decide to borrow a title.

Some features of OverDrive:

  • This service is free to you with your Bentley e-mail address and network password.
  • All titles will automatically expire at the end of the lending period which is 21 days. There are no late fees and if your time runs out, you can just borrow it again.
  • If a title is checked out, place a hold and you are e-mailed when the title is available.
  • For titles with multiple holds, the Library will purchase additional copies decreasing wait times.
  • The plus sign under a title adds to the title to your personal wish list and you can use your wish list to pull up available content when you have the free time to enjoy it.
  • Curated lists, available from the OverDrive homepage, include: Great American Reads, Newest Additions, Most Popular, Try Something Different, Banned & Challenged Books, and Presidential Biographies. Just scroll the main screen to view these curated lists.
  • Each title is selected and added to the collection by your Bentley Librarians, and new titles are added each month.
  • Bentley students, faculty & staff can suggest titles for purchase using the Suggest a Purchase form.

To get started enjoying ebooks & audiobooks on your device visit Getting Started with OverDrive.

If you need help with this service, help is always available at the Reference Desk and there is a special Overdrive Winter Break Reading session scheduled from 11 to noon on Reading Day in Group Study Room 102. Just bring your device and we’ll get you set up.

———————————————

Database of the Month provides a very brief introduction to a useful website or Library resource, highlighting key features you should know about. If you would like more information about this resource (or any of the library’s databases), please contact us for research assistance. If you would like a demonstration of this resource for a class, please schedule a research instruction class using the instruction request form.