Please note that all ProQuest databases and RefWorks will be offline for maintenance from 10:00 p.m. on Saturday, August 20 until 6:00 a.m. Sunday, August 21. Please see details below:

Please note that all ProQuest databases and RefWorks will be offline for maintenance from 10:00 p.m. on Saturday, August 20 until 6:00 a.m. Sunday, August 21. Please see details below:
![]() The Nielsen Segmentation & Market Solutions (SMS) database is now available to Bentley users via the SRDS database platform. Nielsen SMS has replaced the Local Market Audience Analyst (LMAA) database, previously available via SRDS.
The Nielsen Segmentation & Market Solutions (SMS) database is now available to Bentley users via the SRDS database platform. Nielsen SMS has replaced the Local Market Audience Analyst (LMAA) database, previously available via SRDS.
Most of the the information that was available in LMAA continues to be available in Nielsen Segmentation & Market Solutions, but Nielsen SMS provides more data, more robust reports, and a more dynamic and improved search interface. This new database is also compatible with all web browsers (say goodbye to the “Internet Explorer only” restriction).
Nielsen SMS includes access to PRIZM Premier, which is an enhancement over LMAA’s use of PRIZM data. Another notable difference is that Nielsen Consumer Profiles have replaced the Simmons consumer profiles used in LMAA. More information about these features is provided below.
Please note that Nielsen SMS is currently only available to on-campus users, but we are working on a solution to provide off-campus access. Check back here for updates, or contact the Reference Desk for assistance.
The SMS Reports at a Glance document (below) maps the old LMAA content to the new Nielsen SMS database. For example, the data formerly included in a LMAA Demographic Concentration Report can now be found in the Nielsen SMS Consumer Concentration Segmentation Report.

Pop-Facts Demographic Reports provide comprehensive demographic information for your selected analysis area. Geographic analysis is available for states, counties and DMAs (Designated Market Areas). Demographic information is from the most current U.S. Census, estimated current year and projected five-year counts.
Segmentation reports help you determine who your best customers are, where they live, what they are like and how to connect with them.
PRIZM Premier, Nielsen’s consumer segmentation system, defines every U.S. household in terms of 68 demographically and behaviorally distinct segments to help marketers discern those consumers’ likes, dislikes, lifestyles and purchase behaviors. PRIZM Premier’s 68 segments are numbered according to socioeconomic rank (which takes into account characteristics such as income, education, occupation and home value) and are grouped into 11 Lifestage Groups and 14 Social Groups.
Nielsen’s Consumer Profiles uses data from Nielsen’s Scarborough USA+ consumer survey database. This annual survey of 200,000 U.S. adults provides information about consumer lifestyles, product usage, media exposure and psychographic dimensions. Consumer categories include: Alcohol, Automotive, Commuting & Transportation, Digital Video Displays, Environment, Financial, Food & Beverage, Health, Items in the Home, Newspapers, Radio, Restaurants, Retail, Shopping, Sports & Liesure, Telecommunications, Television, Travel, and Voting.
To access the Nielsen Segmentation & Market Solutions database:
Important Information About Shared/Stored Reports & Report Deletion: Please note that all reports created within Nielsen SMS can be viewed and accessed by all Bentley users.
Help documentation is available on the Nielsen SMS log-in page (look at the “introduction to Neilsen SMS” and “How to Use Nielsen” documents). You may also view Nielsen’s 30 minute Online Training Webinar here: https://youtu.be/E75C_HdFaqI
———————————————
Database of the Month provides a very brief introduction to a database available from the Library’s website, highlighting key features of the database that you should know about. If you would like more information about this database (or any of the library’s databases), please contact us for research assistance. If you would like a demonstration of this database for a class, please schedule a research instruction class using this form.
InCitesTM Journal Citation Reports® (JCR) measures research influence and impact at the journal and category, or academic subject, levels and shows the relationship between citing and cited journals. In addition, the JCR® now includes an interactive graphic showing the relationship between citing and cited journals making it easier to visualize the strength of that relationship.
Here is a step-by-step guide to finding the relationships between journals in Journal Citation Reports®

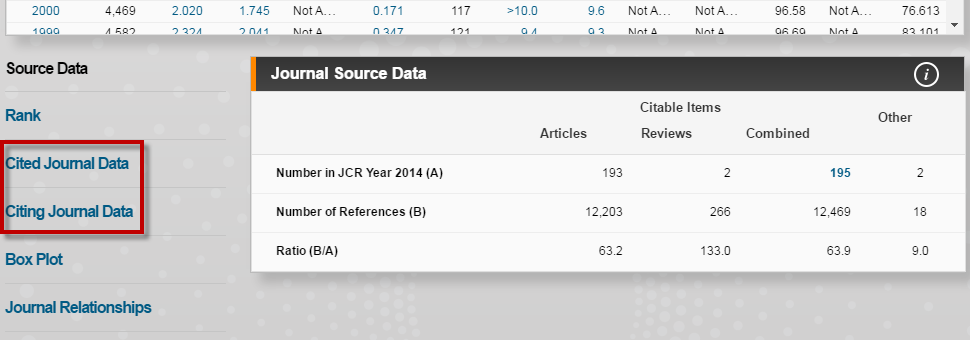
 Within the Journal Profile you will be able to:
 Click on Cited Journal Data – the Cited Journal Graph shows the distribution by cited year of citations to articles published in Behavioral Ecology and Sociobiology.
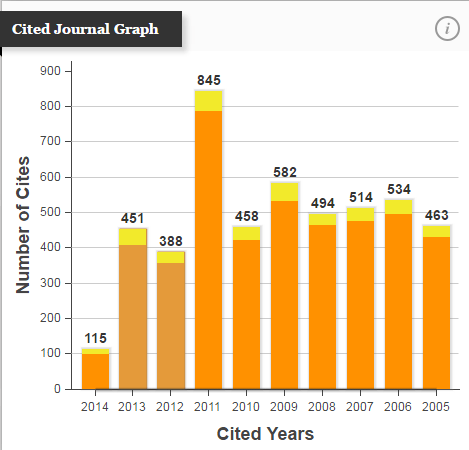
The bottom (orange) portion of each column indicates non self-citations: citations from Behavioral Ecology and Sociobiology to articles in other journals.
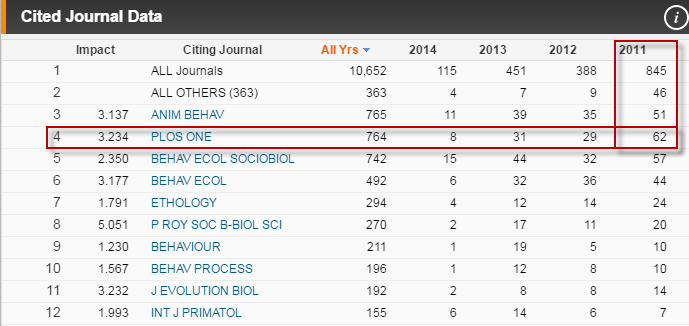
On the Cited Journal Data table, journals that cited Behavioral Ecology and Sociobiology in a given JCR year are listed in order of occurrence.

The bottom (orange) portion of each column indicates non-self-citations – citations from Behavioral Ecology and Sociobiology to articles in other journals.
The Citing Journal Data table reveals a journal’s subject specialty, points to its closest peer or competitor publications, and highlights the network of journals within a particular field or fields. Citing Journal Data table identifies those publications that were most frequently cited by Behavioral Ecology and Sociobiology for a given year – outbound citations.
In this table, the citing journal is Behavioral Ecology and Sociobiology, and all of the citing articles were published in 2014. The journals cited by articles in Behavioral Ecology and Sociobiology are listed in the Cited Journal column.


In the example above, the journals Animal Behavior and PLOS One each contributed a high number of citations to Behavioral Ecology and Sociobiology than other journals in this network. Hovering over the chord between these connected journals will reveal the number of citations in the connection.
Hovering over the citing journal’s arc in the circle will reveal a journal’s impact factor. For example, the Proceedings of the Royal Society B-Biological Sciences, a citing journal, has an impact factor of 4.823.
A journal’s impact factor (JIF) is an indicator of the importance of a journal to its field. The higher the impact factor, the greater the perceived importance of the contribution this journal – and in turn, its related journals – has on its academic or research fields.
To learn more about what InCitesTM does and does not do, go to Angela Cochoran’s Interview with Thomson Reuters: InCites Platform Offers New Analytics and Transparency at The Scholarly Kitchen.
Database of the Month provides a very brief introduction to library databases and selected web resources, highlighting key features of the database that you should know about. If you would like assistance using this database, please schedule a research consultation using this form. For more information about the library’s databases contact the Reference Desk.
ReferenceUSA is a strong, reliable database filled with directory information on businesses and people. It is most popularly used for getting detailed company information or to create a list of competitors in a specific industry. It contains private and public company information and is updated monthly.
ReferenceUSA is available online to all Bentley community users with active Bentley coordinates; find it on Bentley Library’s Databases A-Z page.
Students of GB320 are the most likely users of this resource, especially for company research assignments. Other typical projects informed by ReferenceUSA are business intelligence or research for an upcoming interview.
Our sample search today is research for an upcoming interview (see below).
ReferenceUSA generates data in the form of addresses, phone numbers, and URLs, without narrative comment or storyline. The ReferenceUSA search interface guides users to select parameters and the database dynamically generates this list.
Sample search for potential internship places
The sample search that follows is preparation for an upcoming interview. In this scenario, the goal is to identify organizations and inquire about internships. We will look for small organizations specializing in disaster relief work in the south of the United States.


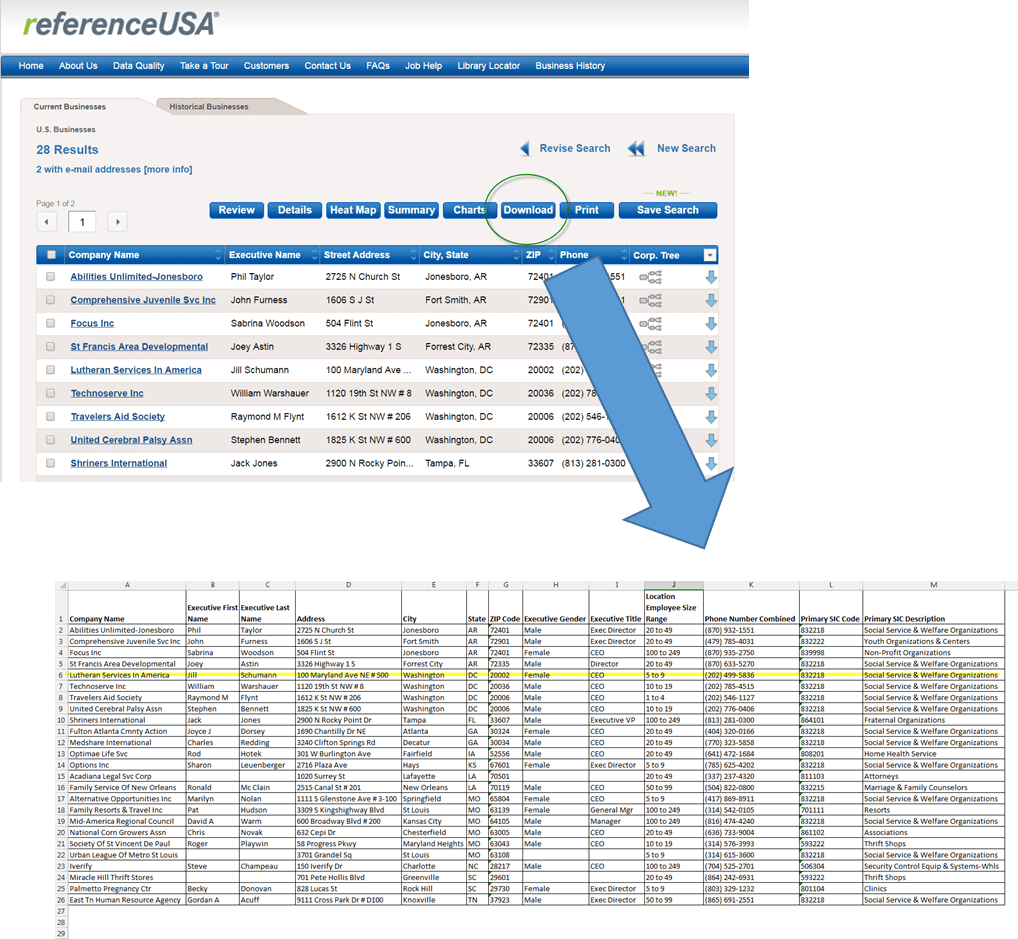
You’re done! These are leads to pursue for a future internship.
ReferenceUSA prioritizes accuracy very highly and fact-checks everything by telephone calls. ReferenceUSA culls its information from the US White page telephone directories, the U.S. Census Bureau, and from publicly filed records. It has estimated 44 million US businesses, 1.5 million of them closed and 4.5 of them newly established, making historical analysis or projections possible.
Other goodies:
For self-help, ReferenceUSA provides user-contributed how-to videos under the “Take a Tour” tab, each of these recordings explain the search process in under 5 minutes.
———————————————
Database of the Month provides a very brief introduction to a database available from the Library’s website, highlighting key features of the database that you should know about. If you would like more information about this database (or any of the library’s databases), please contact us for research assistance. If you would like a demonstration of this database for a class, please schedule a research instruction class using this form.
Off-campus users of Google Scholar can now configure Scholar to offer links to content from academic journals made available by the Bentley University Library and make the experience as seamless as accessing Scholar from on campus.
Go to Google Scholar at https://scholar.google.com/ or enter your search in the search box under the Google Scholar tab on the Bentley University Library website. After Scholar loads click on the “Settings” link at the top of the Google Scholar search page.

From the Settings page choose “Library links”and enter Bentley University Library in the search box and then click the search button. Please make sure your browser is set to accept cookies. If your browser does not accept cookies you will need to update the Google Scholar library links for Bentley every time you use Scholar.

Search Google Scholar and when you see “Full-text@Bentley”in the results list you will be able to access that resource using your Bentley University username and network password.


Business Insights: Essentials provides in-depth information on U.S. and international businesses (both public and private) and industries. Included are company profiles, industry profiles, financial data, investment reports and articles from business periodicals. The strength of this database comes from its underlying sources. It is a great resource for getting a company’s history, market share and SWOT analysis. It is also a great resource for getting an overview of a particular industry as well.
Usage tip: Start by searching for a company name (such as Wal-mart) or ticker symbol (such as WMT) in the keyword box and look through your results for the company profile. This will create a “dashboard” view of all of the available reports regarding your company including:

The company profile also provides a Related Articles area that groups current article content into specific subject categories. These articles help to update the above reports with the most current data available. The Related Articles are grouped into these categories:
Remember, when you click on one of these subject categories in the company profile, you will only link to articles relevant to this specific company.
The company profile also includes the industry names and the NAICS codes in which the company operates including the one indicated as the Primary Industry. Clicking on the linked title (see below image) will bring up an industry profile.

Of note: searching for the NAICS code (such as 452990) in the keyword search box on the database’s homepage will also bring up an industry profile.
An industry profiles lists “Top Companies” by Revenue and provides “Industry Essays” (sourced from the Gale Business Insights Online Collection, 2016 which consists of these encyclopedias: Encyclopedia of American Industries; Emerging Industries & Global Industries).
Business Insights: Essentials can be used to compare companies and/or industries using available metrics. This feature is available under the Comparison Charts drop down menu from the database’s homepage.
Comparison charts & data can be exported into Excel.
———————————————
Database of the Month provides a very brief introduction to a database available from the Library’s website, highlighting key features of the database that you should know about. If you would like more information about this database (or any of the library’s databases), please contact us for research assistance. If you would like a demonstration of this database for a class, please schedule a research instruction class using this form.
Mediamark University Internet Reporter is a profiling system used to define targets in order to gain insights and better understand markets and/or the media used to reach those markets. First time Mediamark users must register and create an account before they can us the database. Users should contact the Bentley University Library at 781.891.2300 or refdesk@bentley.edu to receive a registration code to be entered when creating a Mediamark account. Mediamark is available to current Bentley University students, faculty and staff.
Registration Steps:

After registering for an account users will be able to access data on media use, product use, behavioral and other marketing measures from Mediamark’s yearly national probability sample of consumers. The University Internet Reporter provides access to GfK MRI’s Survey of the American Consumer for academic use by students and faculty. The Survey’s vast database of media usage, demographics, psychographics and consumer behavior makes it a powerful resource for penetrating insight into the actions and motivations of adult American consumers.
Once logged in users will select a Category for a list of over 25 product areas:

Users will then select a Question — a consumer activity. Once the consumer activity has been selected users will be able to create a report based on Target criteria including report type, consumer activities (Details) and demographics (Target).

The understand how the Mediamark University Reporter presents information in a report users should download the Mediamark University Internet Reporter Tutorial.
———————————————
Database of the Month provides a very brief introduction to a database available from the Library’s website, highlighting key features of the database that you should know about. If you would like more information about this database (or any of the library’s databases), please contact us for research assistance. If you would like a demonstration of this database for a class, please schedule a research instruction class using this form.
ACM Digital Library, published by the Association for Computing Machinery, is a comprehensive collection of full-text articles and citations covering the fields of computing and information technology. A noteworthy strength of this database is full-text access to conference papers containing emerging research within the ACM’s special interest groups (SIGs).
This database is particularly useful for those pursuing research in the areas of computer science and/or Human Factors Information Design.
Our subscription includes:
Search, Retrieval and Export
Browsing options are available on the main page, including a page containing names and descriptions of each SIG. Each interest group focuses on a specific area of computer science research; the searcher with a specific area of interest may wish to click a group name to narrow his/her search to a particular group.
Basic and Advanced searches are also provided. Advanced searching enables the user to join keywords or phrases to form a tailored search. Both the Basic and the Advanced searches allow the user to refine the result set by author, institution, conference name, date, publication name, and more.
Several options for exporting citations are available, including Endnote and CSV.
Personal Web Account
Sign up for a free Web account to save searches. Using the My Binder feature (available after login), the user can compile a bibliography of citations from the database.
Database Help
Visit the Training & Resources page to schedule an online training session, watch videos, set up RSS alerts for Tables of Contents, and more.
Connect to this Database
Please visit the ACM Digital Library page to start your research. ACM also provides a mobile app for Android, Apple iOS, and Windows phones, available in the app store for the specific device.
———————————————
Database of the Month provides a very brief introduction to a database available from the Library’s website, highlighting key features of the database that you should know about. If you would like more information about this database (or any of the library’s databases), please contact us for research assistance. If you would like a demonstration of this database for a class, please schedule a research instruction class using this form.